News from the Indico World
Monitor your Indico with Prometheus
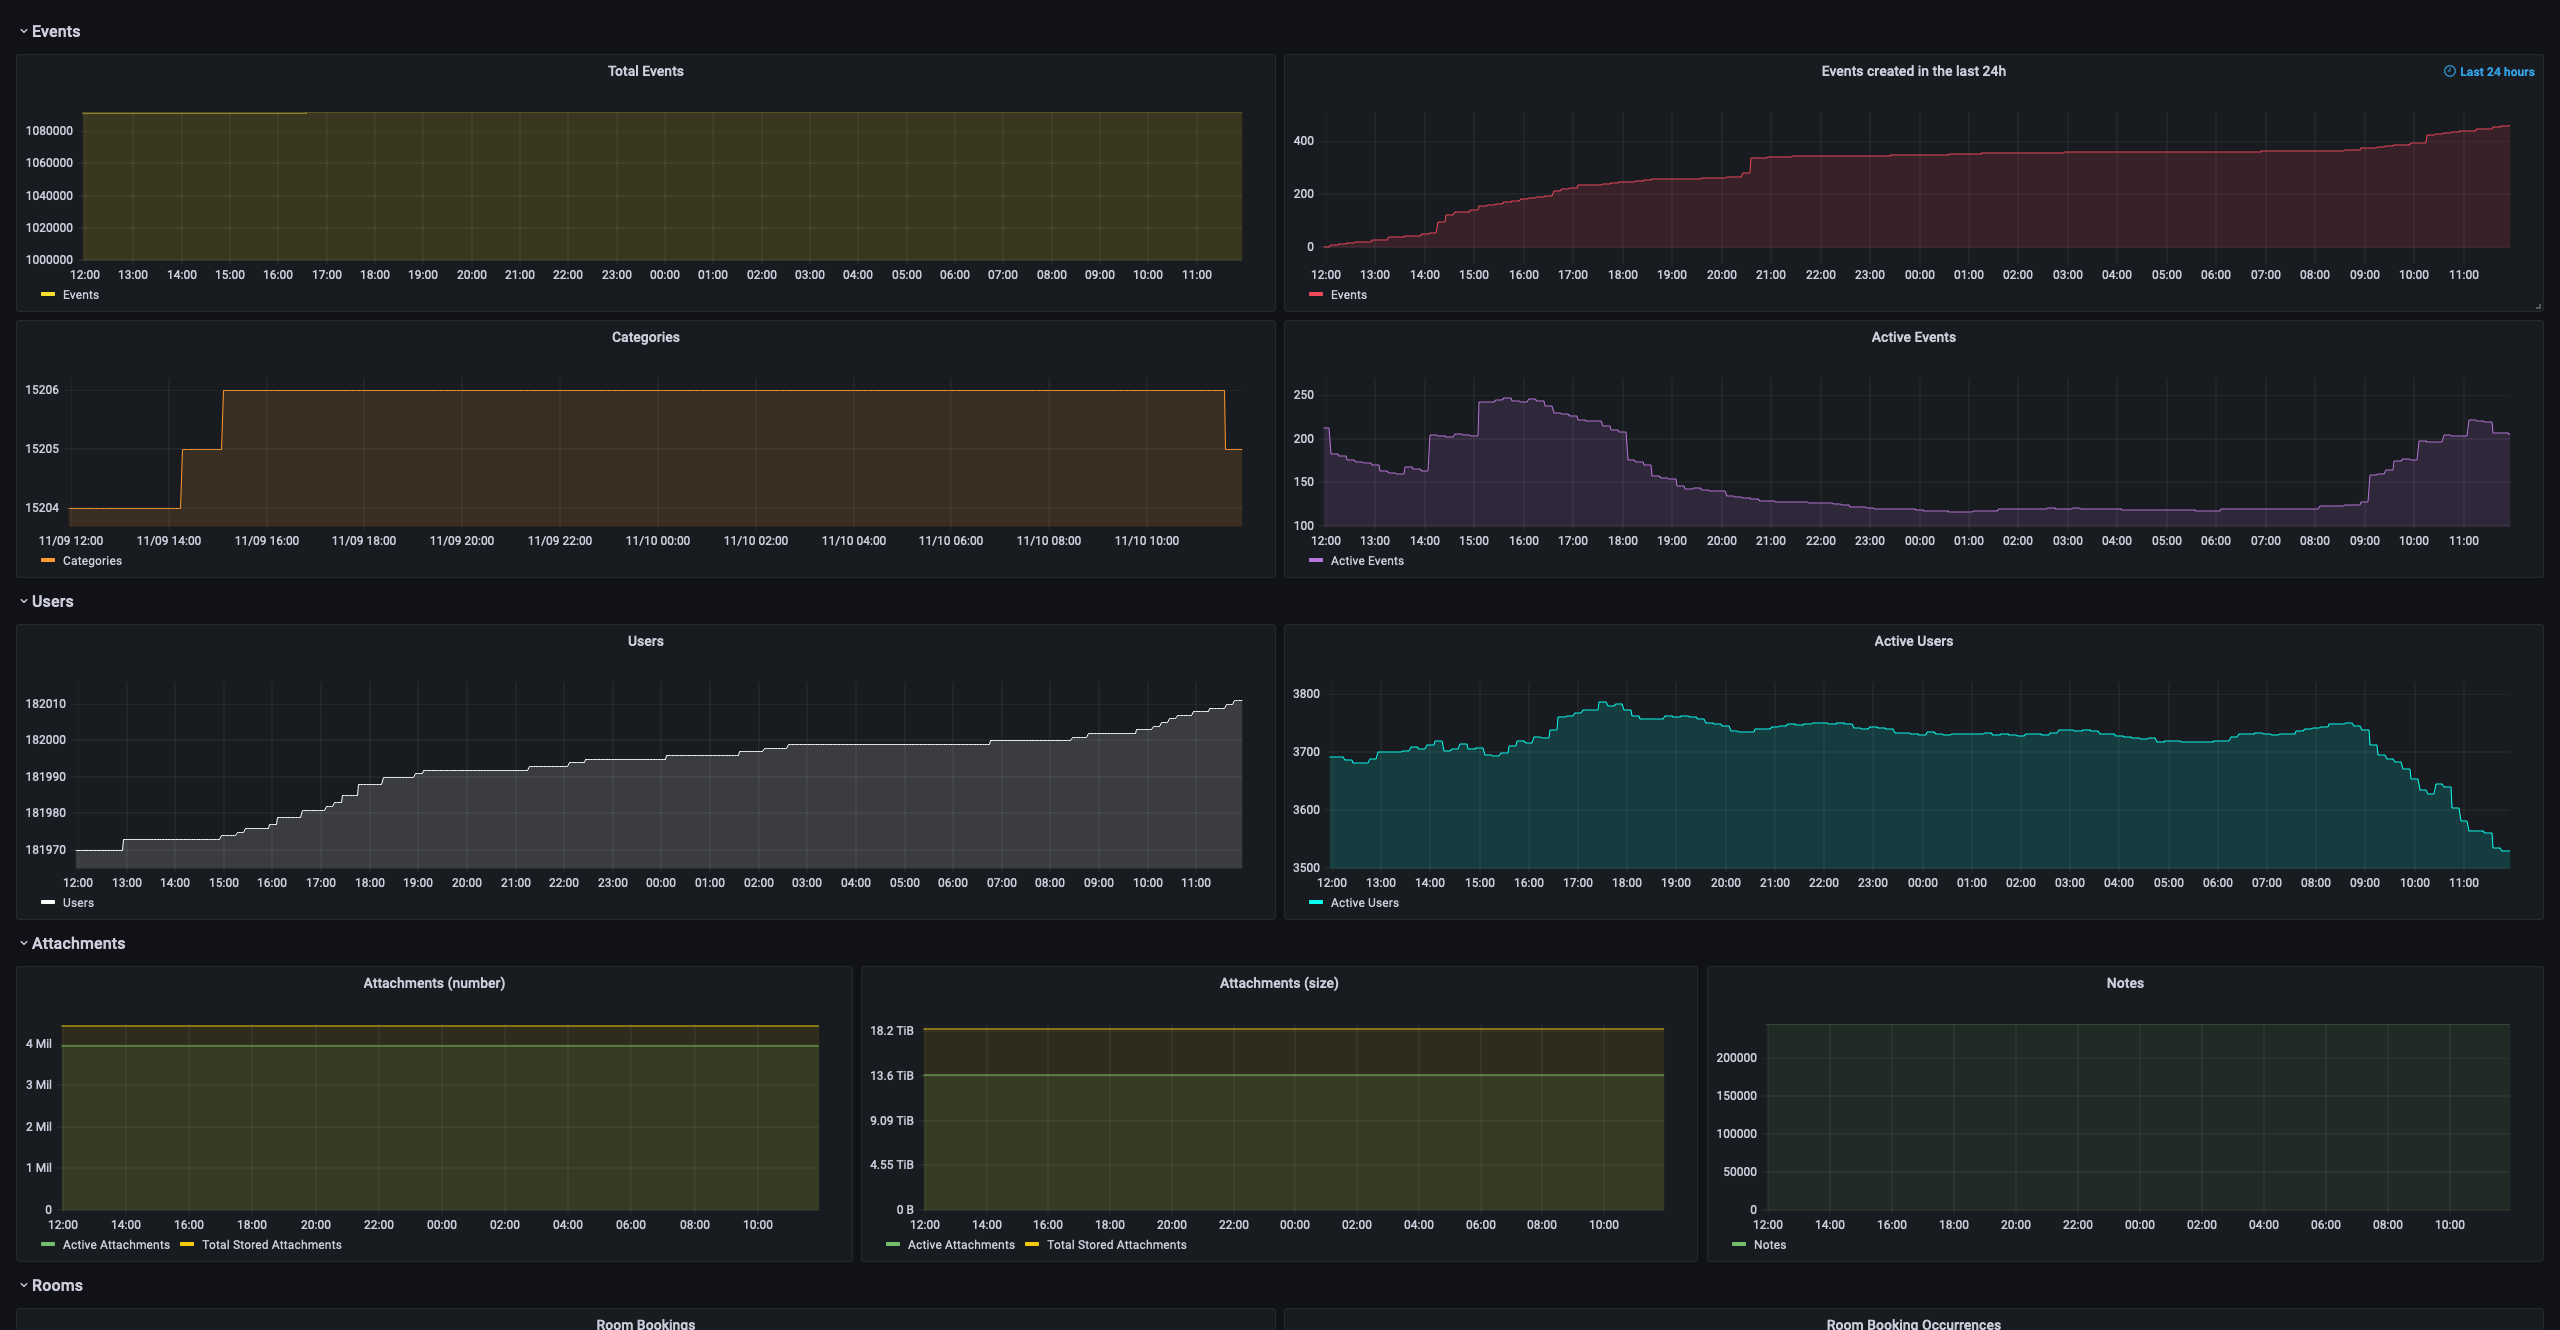
At CERN we run the world’s biggest public Indico server, which hosts more than 1 million events and almost 4 million single attachment files.
Knowing your growth rate is very important when you’re providing a service, and although it’s easy to gauge its scale through database queries and some experience, it’s not that trivial to keep track of the evolution of those metrics. Having an insight into these metrics helps us to answer some of our most burning questions, such as: ‘How has our user base been growing? How are our storage needs evolving?’. Plus, we’ve always wanted to have fancy charts we can present to people who are not that familiar with the tool nor the service we are providing.
With that in mind, we developed indico_prometheus an Indico plugin which provides a Prometheus-compatible endpoint which can be plugged into your own Prometheus instance and then your favorite dashboard tool (e.g. Grafana). indico_prometheus will take a regular snapshot of your Indico database and extract the most relevant metrics, which can then be imported, processed and displayed in the way of your liking.
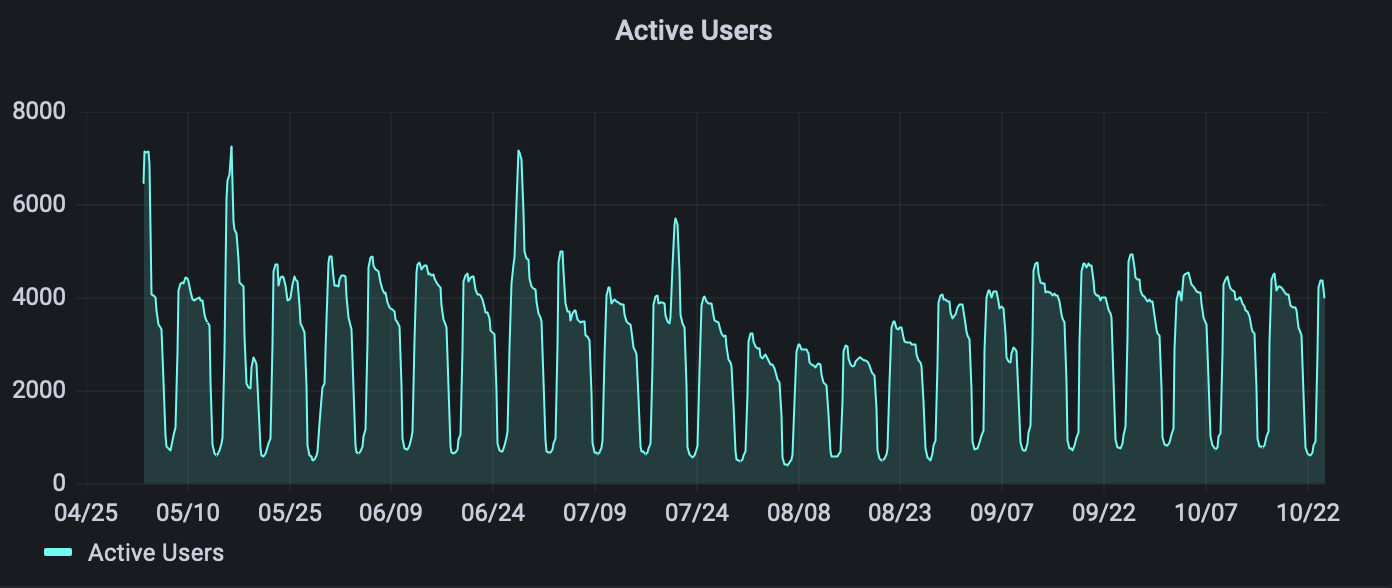
Thanks to this tool, we can now have a sense of our most active usage periods (notice how the weekends are visible on this chart):
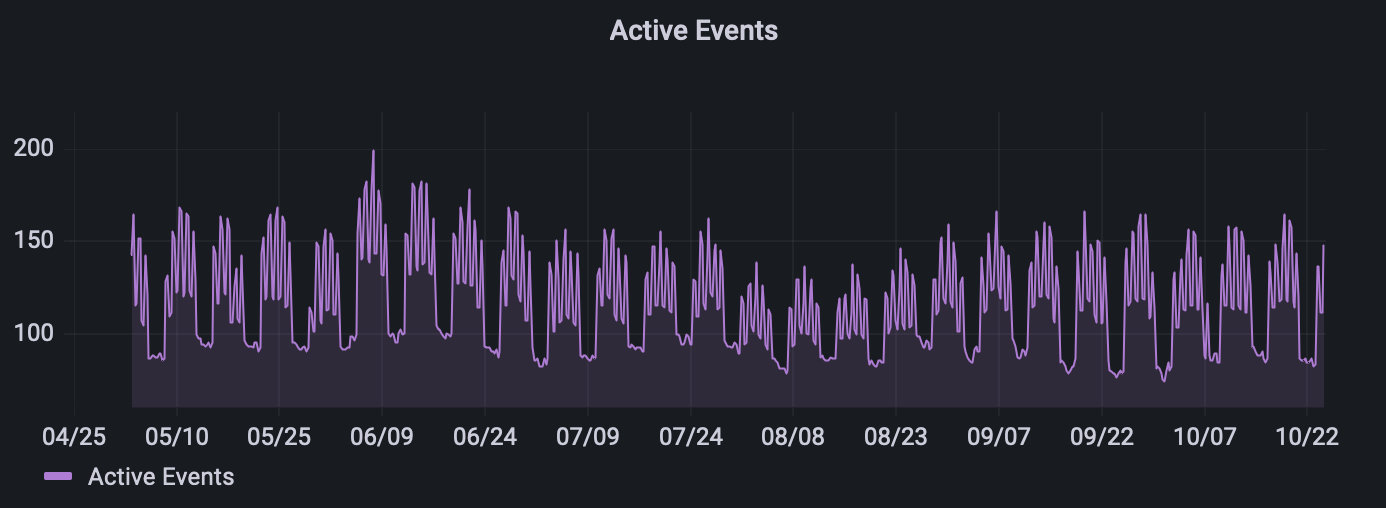
We can also, for instance, see that at CERN we have up to 200 events happening simultaneously, and that there is always something going on, thanks to the various timezones on which our various collaborations work:
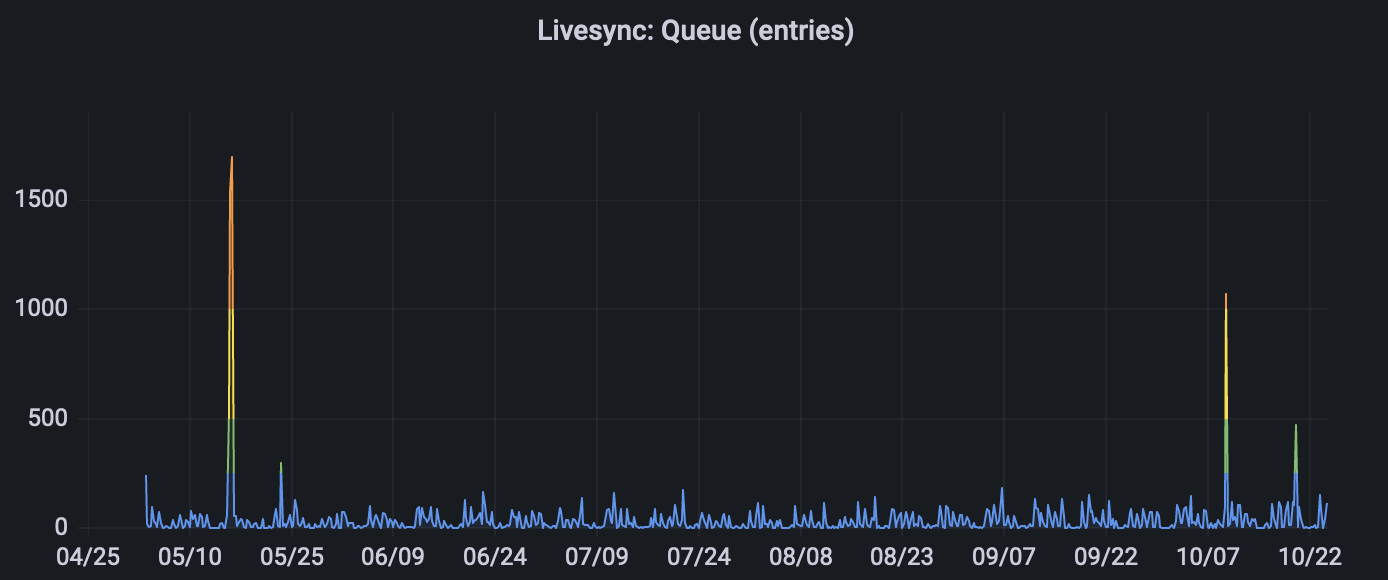
The plugin also exposes more maintenance-oriented metrics, such as how many synchronization tasks we have queued up, waiting to be sent to the full-text search engine:
indico_prometheus is of course open-source software and can be installed like any other Indico plugin.